Features
1. Real-Time Observation during Measurement
Changes in the sample status can be displayed in “real time.” The images are linked with the temperature and can be viewed just by clicking the data streams.
2. Image Data Analysis linked with Temperature and Signal
Stored image data can be displayed in either thumbnail or slide show format, linked with the temperature and signals.
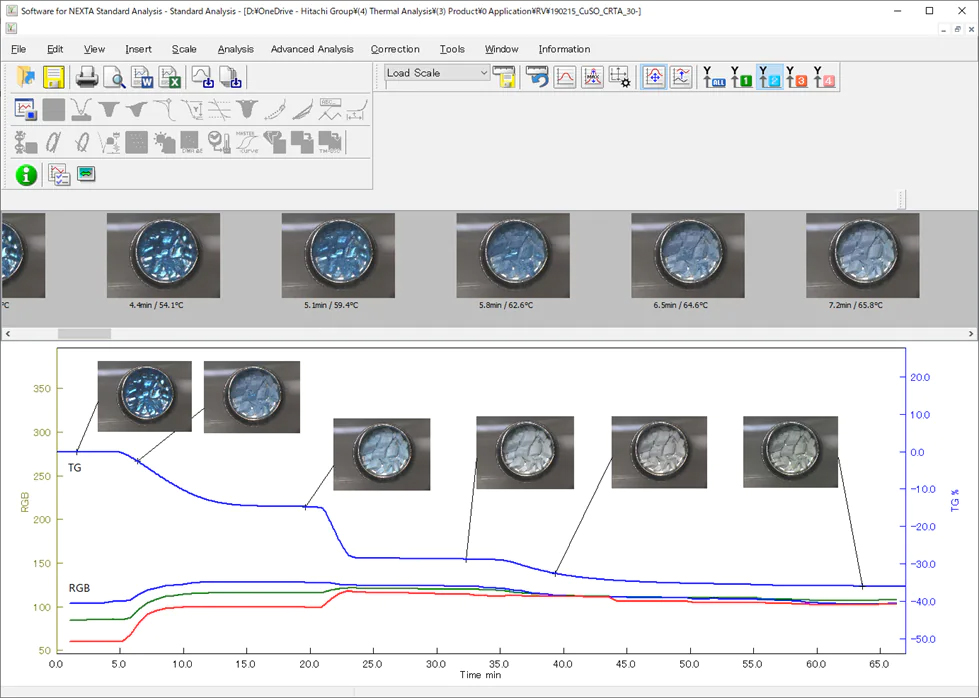
Thumbnails display
Thumbnail Images can be displayed. Linked images can be shown by clicking any point on the signal curve.
Slideshow display
The slide show feature shows the series of images as if they were a movie file. The signal data points change to correspond to the movie’s timeline.
3. Enhanced “measuring” function
- Image editing
- Dimension measurement
- Digital zoom
- Color (RGB/CMYK/Lab) analysis