Applications
Fluorescence properties and morphology of microstructured material
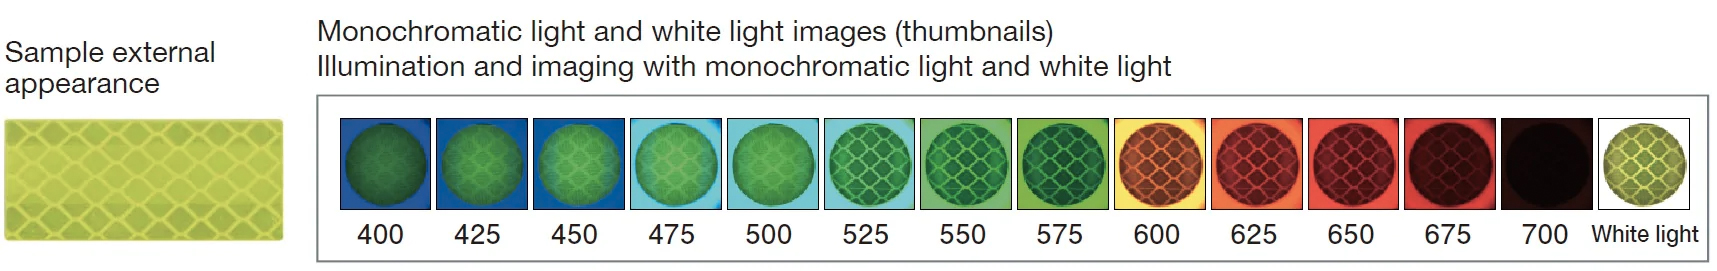
A fluorescent reflective sheet with a microstructure to improve its visibility was measured.
Simultaneous capture of spectrum data and image
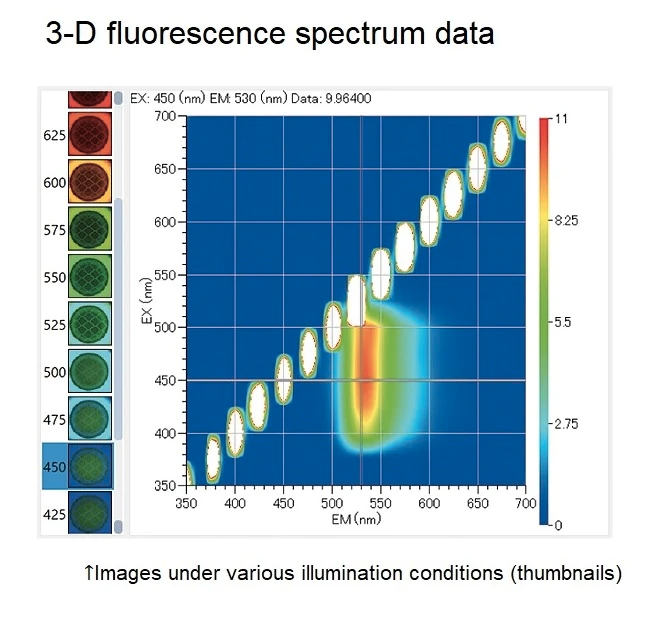
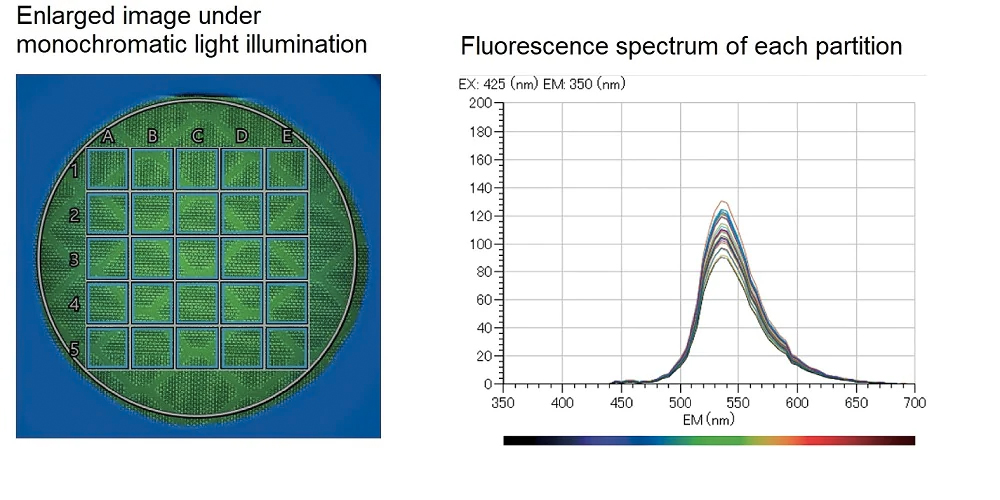
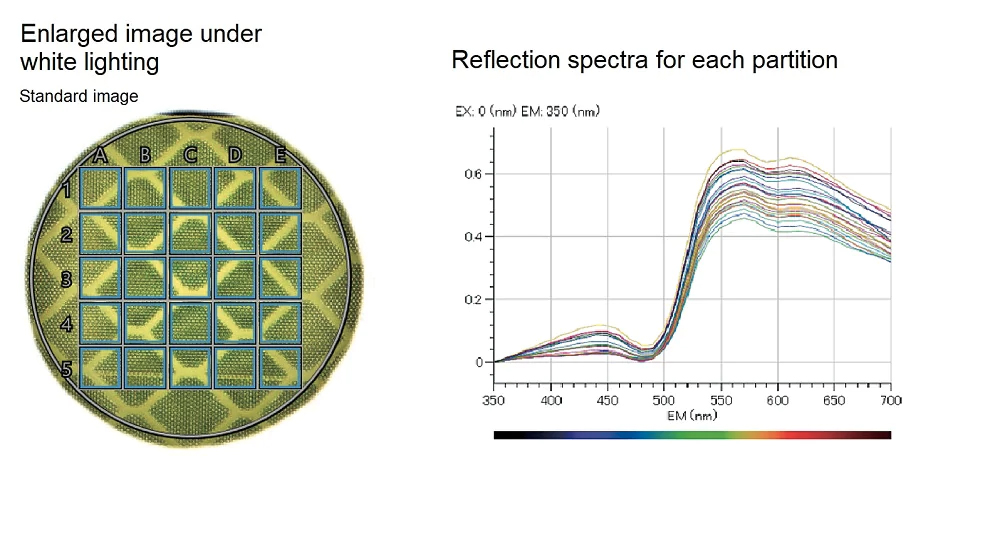
The sample is illuminated with monochromatic light at wavelengths of 360 to 700 nm and with white light. An image is captured under each illumination condition, and the fluorescence spectrum is simultaneously acquired by the fluorescence-side spectroscope. After measurement, the 3-D fluorescence spectra are displayed (excitation wavelength, fluorescence wavelength, and fluorescence intensity). An enlarged image and fluorescence and reflection spectra for each partition can be displayed using the dedicated analysis software. The reflection and fluorescence distribution of samples with in-plane nonuniformity can be captured as images and spectra.
Spectral calculation and display of each partition (fluorescence and reflection)
Separated image display (fluorescence and reflection)
Separation of a captured image into a reflected light image and a fluorescence image
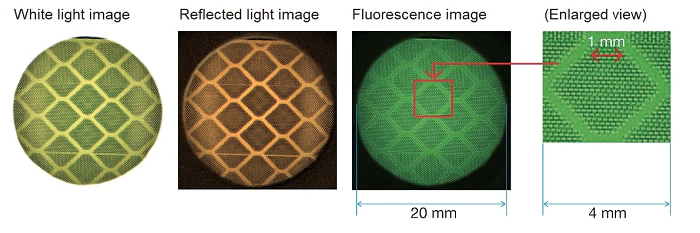
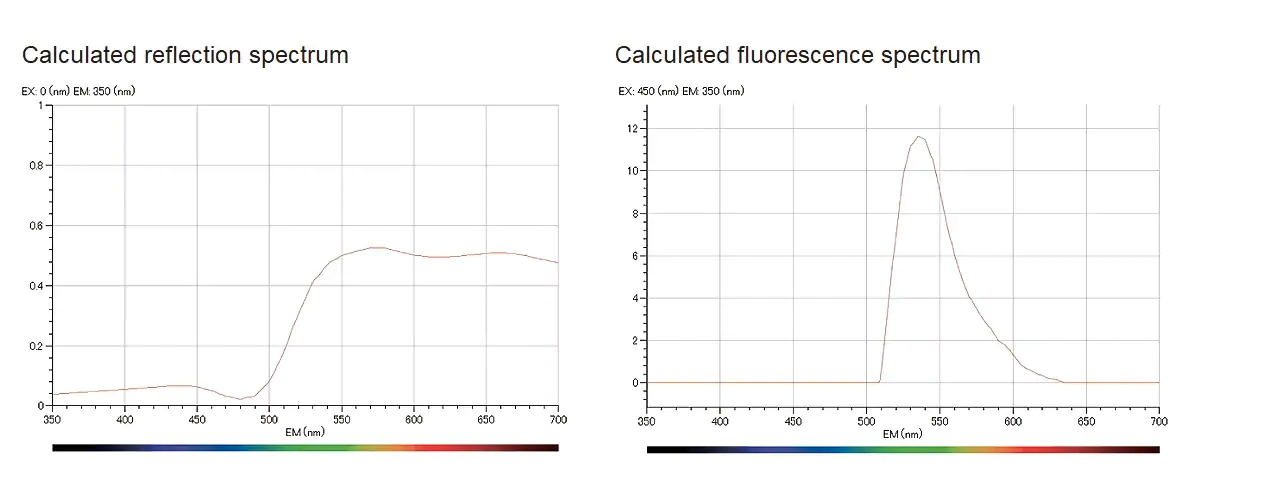
A captured image was separated into a reflected light image and a fluorescence image using an image separation algorithm. The reflection image was orange and the fluorescence image was green. The separated images correspond to the reflection spectrum and fluorescence spectrum, respectively, and by summing the orange reflection image and the green fluorescence image, the sample appears yellowish. It was found that the in-plane optical characteristics (optical pattern) in the reflection image and the fluorescence image were different. When the image was enlarged, it could be seen that the microstructure of the reflecting plate had a period of about 200 μm.
